

- 📊 Tool-level telemetry
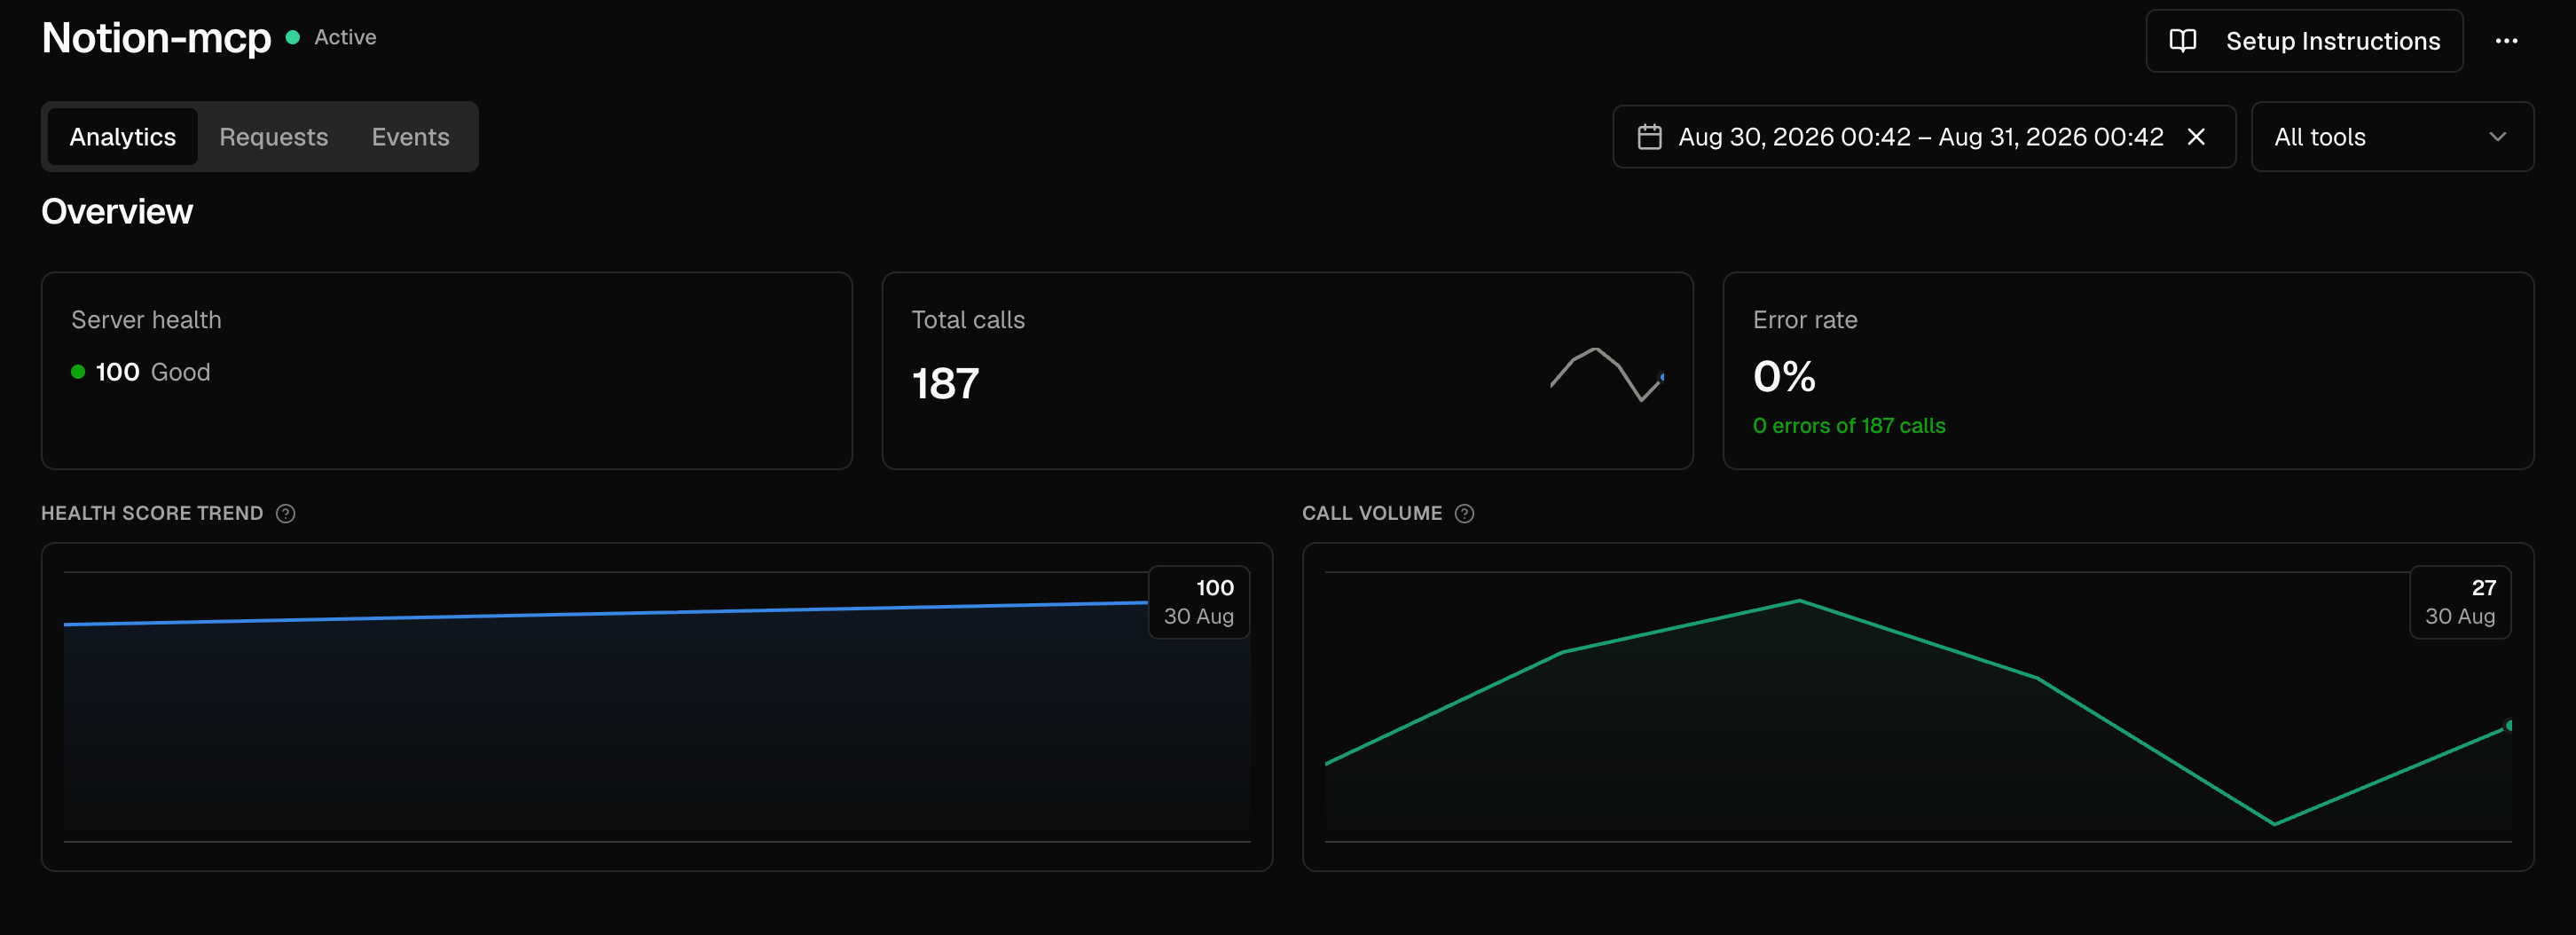
- 🩺 Server health score
- 🧠 Tool intelligence
- 🎯 Result quality scoring
- 🔌 Works with any MCP server -
mcpfy-sdk, the official MCP SDK (@modelcontextprotocol/sdkfor TypeScript,mcpfor Python), FastMCP, or a server you didn’t write at all
How it works
Every MCP transport - stdio, SSE, StreamableHTTP - funnels all JSON-RPC traffic through one seam: asend/onmessage pair in TypeScript, a read/write stream pair in Python. Pulse wraps that seam, so it sees every request and response regardless of which SDK built the server.
For servers you don’t have the source for, mcpfy-proxy does the same thing from the outside: it becomes the process your MCP client spawns, runs the real command as its own child, and forwards every byte between them unchanged while classifying JSON-RPC messages on the side.
None of the three install modes below edit your files for you. Pick the one that matches your situation.
What can be tracked
Pulse classifies every JSON-RPC message crossing the wrapped seam and turns it into structured events - never raw content. This is what directly powers the dashboard’s Connections & Clients, Tools & Catalog Quality, and Server Signals sections.Get your API key
Every install mode needs an API key. Create one from your MCPfy dashboard (Dashboard → Telemetry), then set it as theMCPFY_API_KEY environment variable.
Open Telemetry Dashboard
Create an API key and see what the dashboard shows once events start flowing.
Which install mode do I need?
I'm building with mcpfy-sdk
Pulse ships bundled with
mcpfy-sdk. Set MCPFY_API_KEY and restart your server - no code to write.I wrote my own server and can edit its code
Install
mcpfy-pulse and add two lines to your code, right before you connect your transport or run your server. See the TypeScript or Python guide.I'm running someone else's server locally
A server from GitHub or npm, running under Claude Desktop or Cursor. Route its command through
mcpfy-proxy in your MCP client’s config - no code needed. Covered in both the TypeScript and Python guides.Next steps
TypeScript
Install and configure
mcpfy-pulse for Node.js MCP servers.Python
Install and configure
mcpfy-pulse for FastMCP or the official mcp SDK.View telemetry in the dashboard
See tool-level usage, health scores, and quality signals once data starts flowing.