

Create a telemetry setup
1
Open the Telemetry dashboard
Navigate to mcpfy.ai/dashboard/telemetry and start a new setup.
2
Tell us how you're running your server
Pick the option that matches your situation:
- I’m building with mcpfy-sdk
- I wrote my own server and can edit its code
- I’m running someone else’s server on my computer
3
Get your API key
MCPfy generates an API key for this setup. Copy it - you’ll use it as
MCPFY_API_KEY in the TypeScript or Python install steps.Waiting for the first event
Until your server sends its first event, the setup shows a “Waiting for the first event” state with your API key (hidden by default - reveal or copy it from there) and the same setup instructions from step 2. Nothing to do here except finish wiring up the SDK - the first event usually shows up within a few seconds of your server’s next request.Lost the setup instructions? Every telemetry setup has a Setup Instructions button that reopens the same picker at any time.
Once data is flowing
The setup page opens into three tabs: Analytics, Requests, and Events.Analytics
A single scrollable page, ordered roughly by how often you’d check each section. Use the date-range picker and tool filter at the top to scope it - the tool filter only narrows Overview and Results & Payloads, the other sections aren’t tool-scoped.Overview
Is anything broken right now? A health-score badge, total calls, and error rate, plus health-score and call-volume trend charts.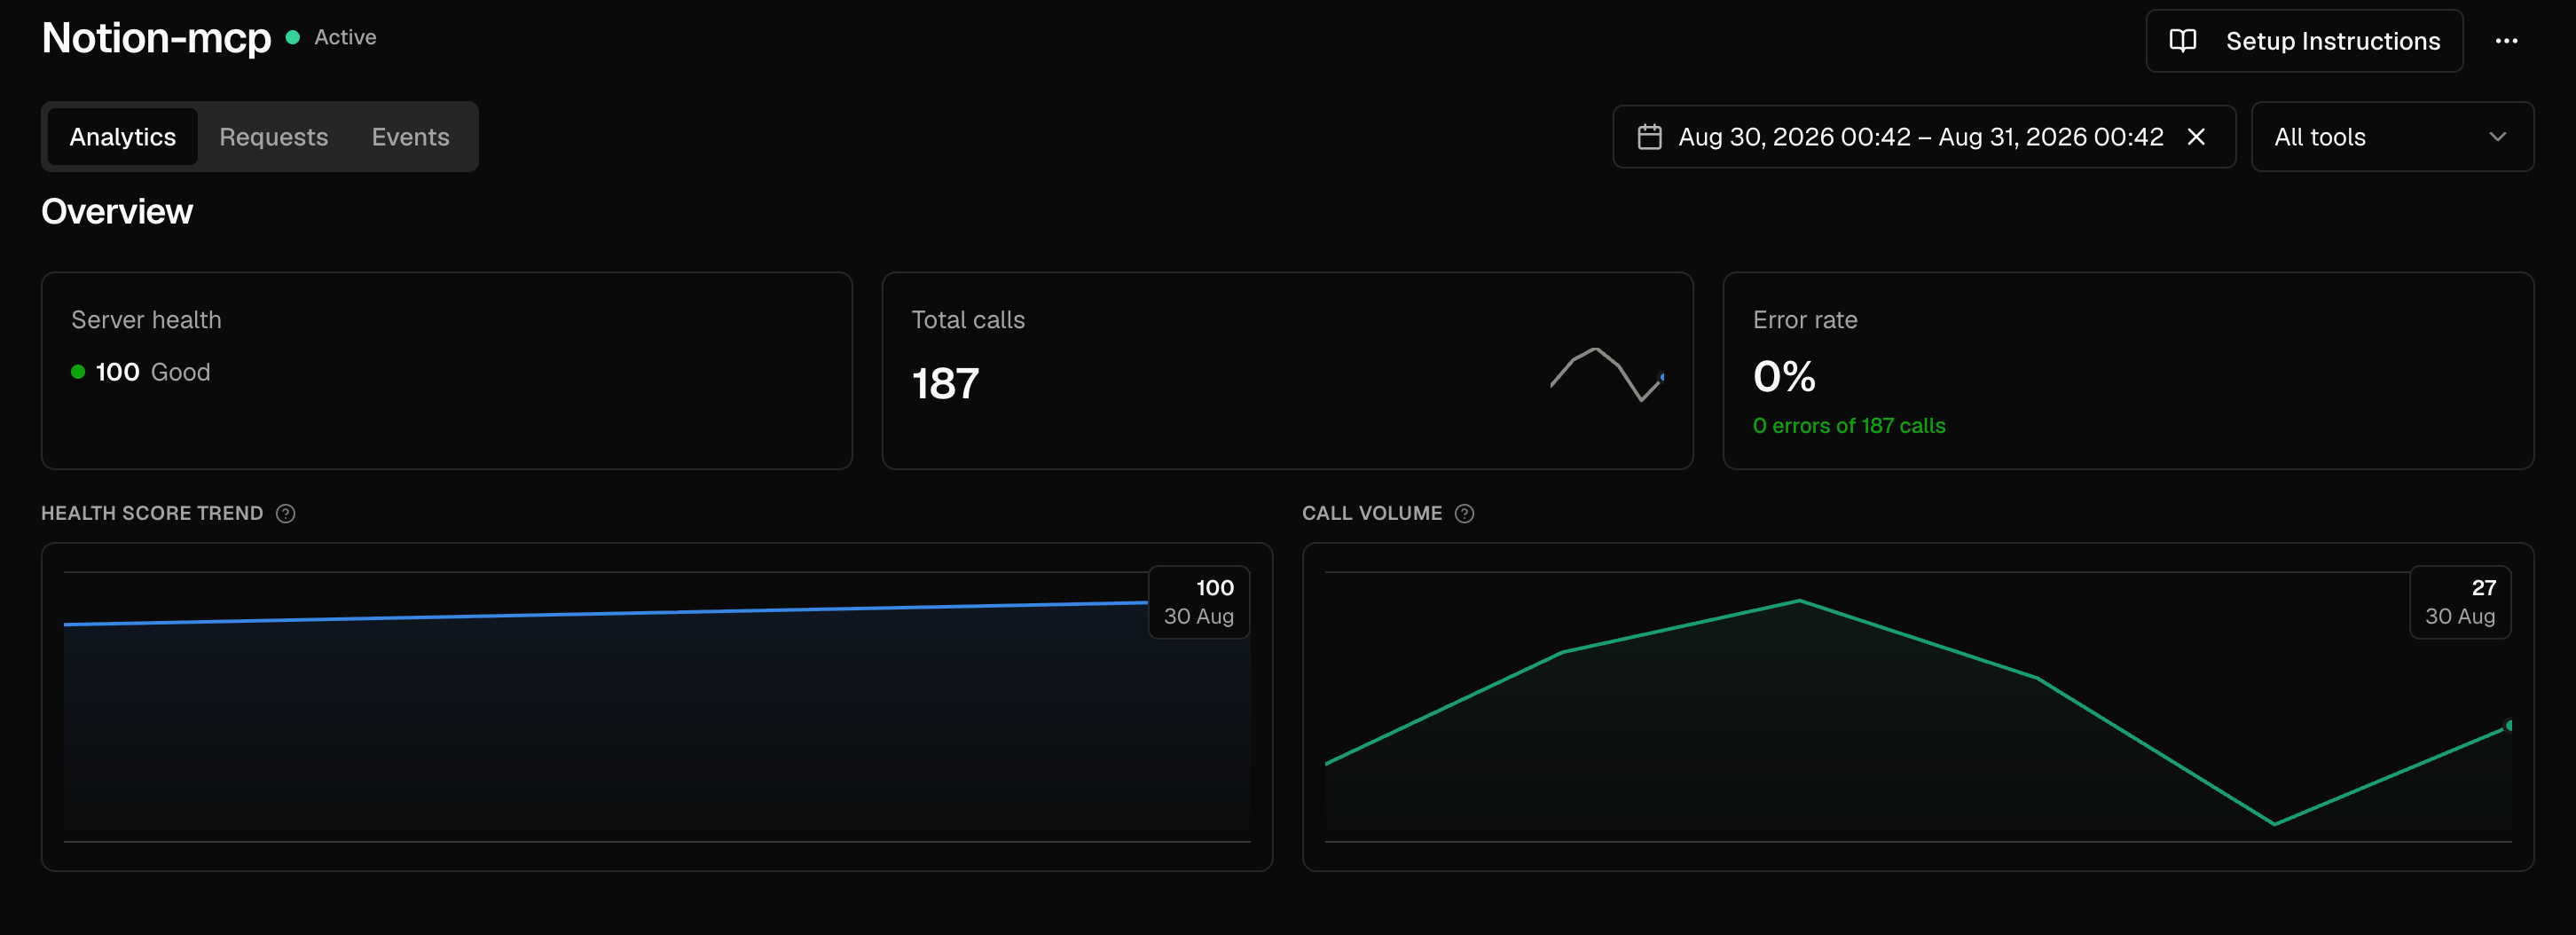
Connections & Clients
Who’s actually connecting - handshake health, which optional capabilities connecting clients support, and a breakdown of client name/version by session.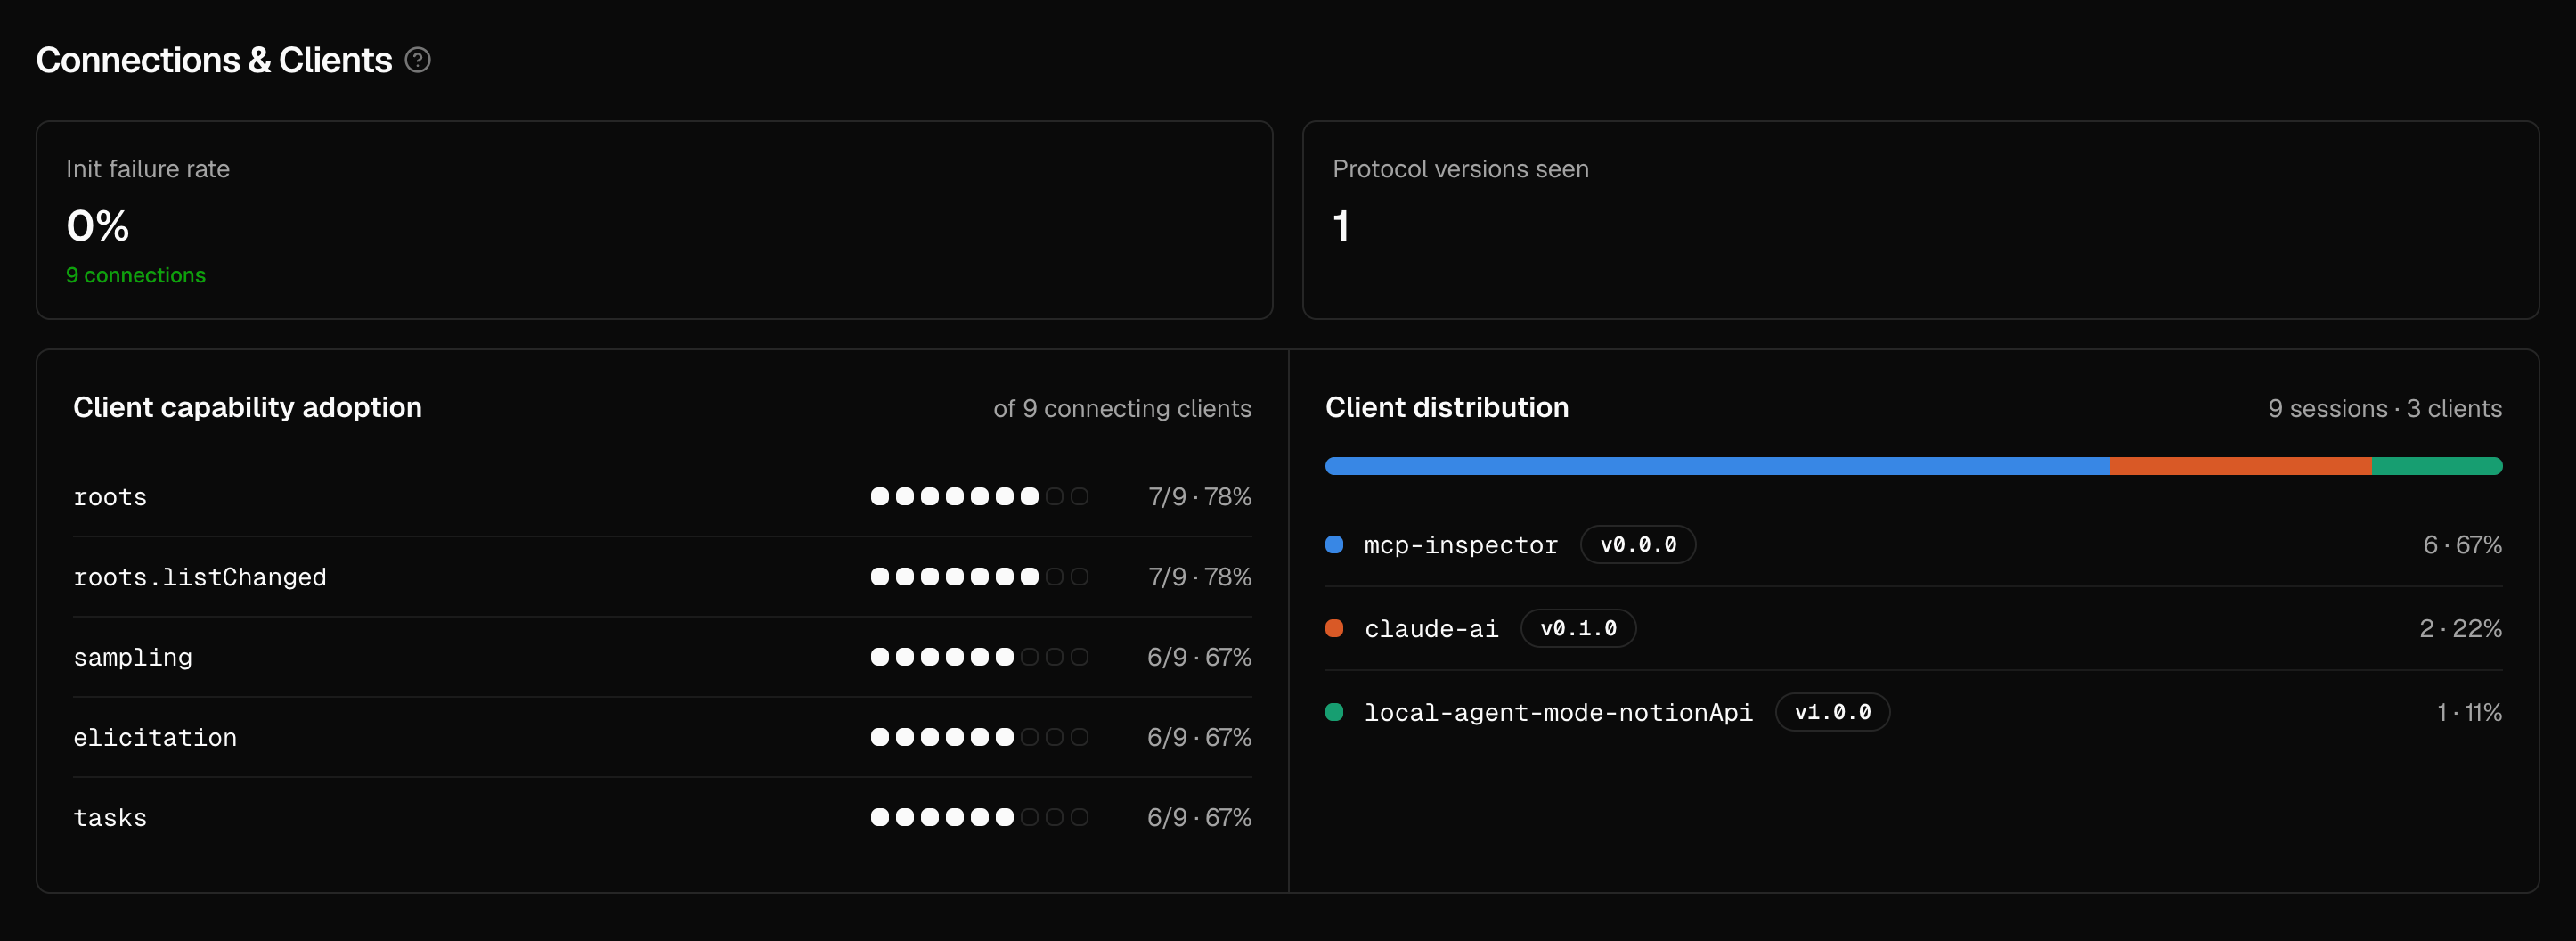
Results & Payloads
What’s coming back - result quality over time.Tools & Catalog Quality
Is this server well-built for an LLM caller? Declared vs. called tools, catalog coverage, which tools have never been called, plus a per-tool table with call count, error rate, cancel rate, P95 latency, and risk flags (e.g. destructive tools) - the same tool catalog graded at two granularities.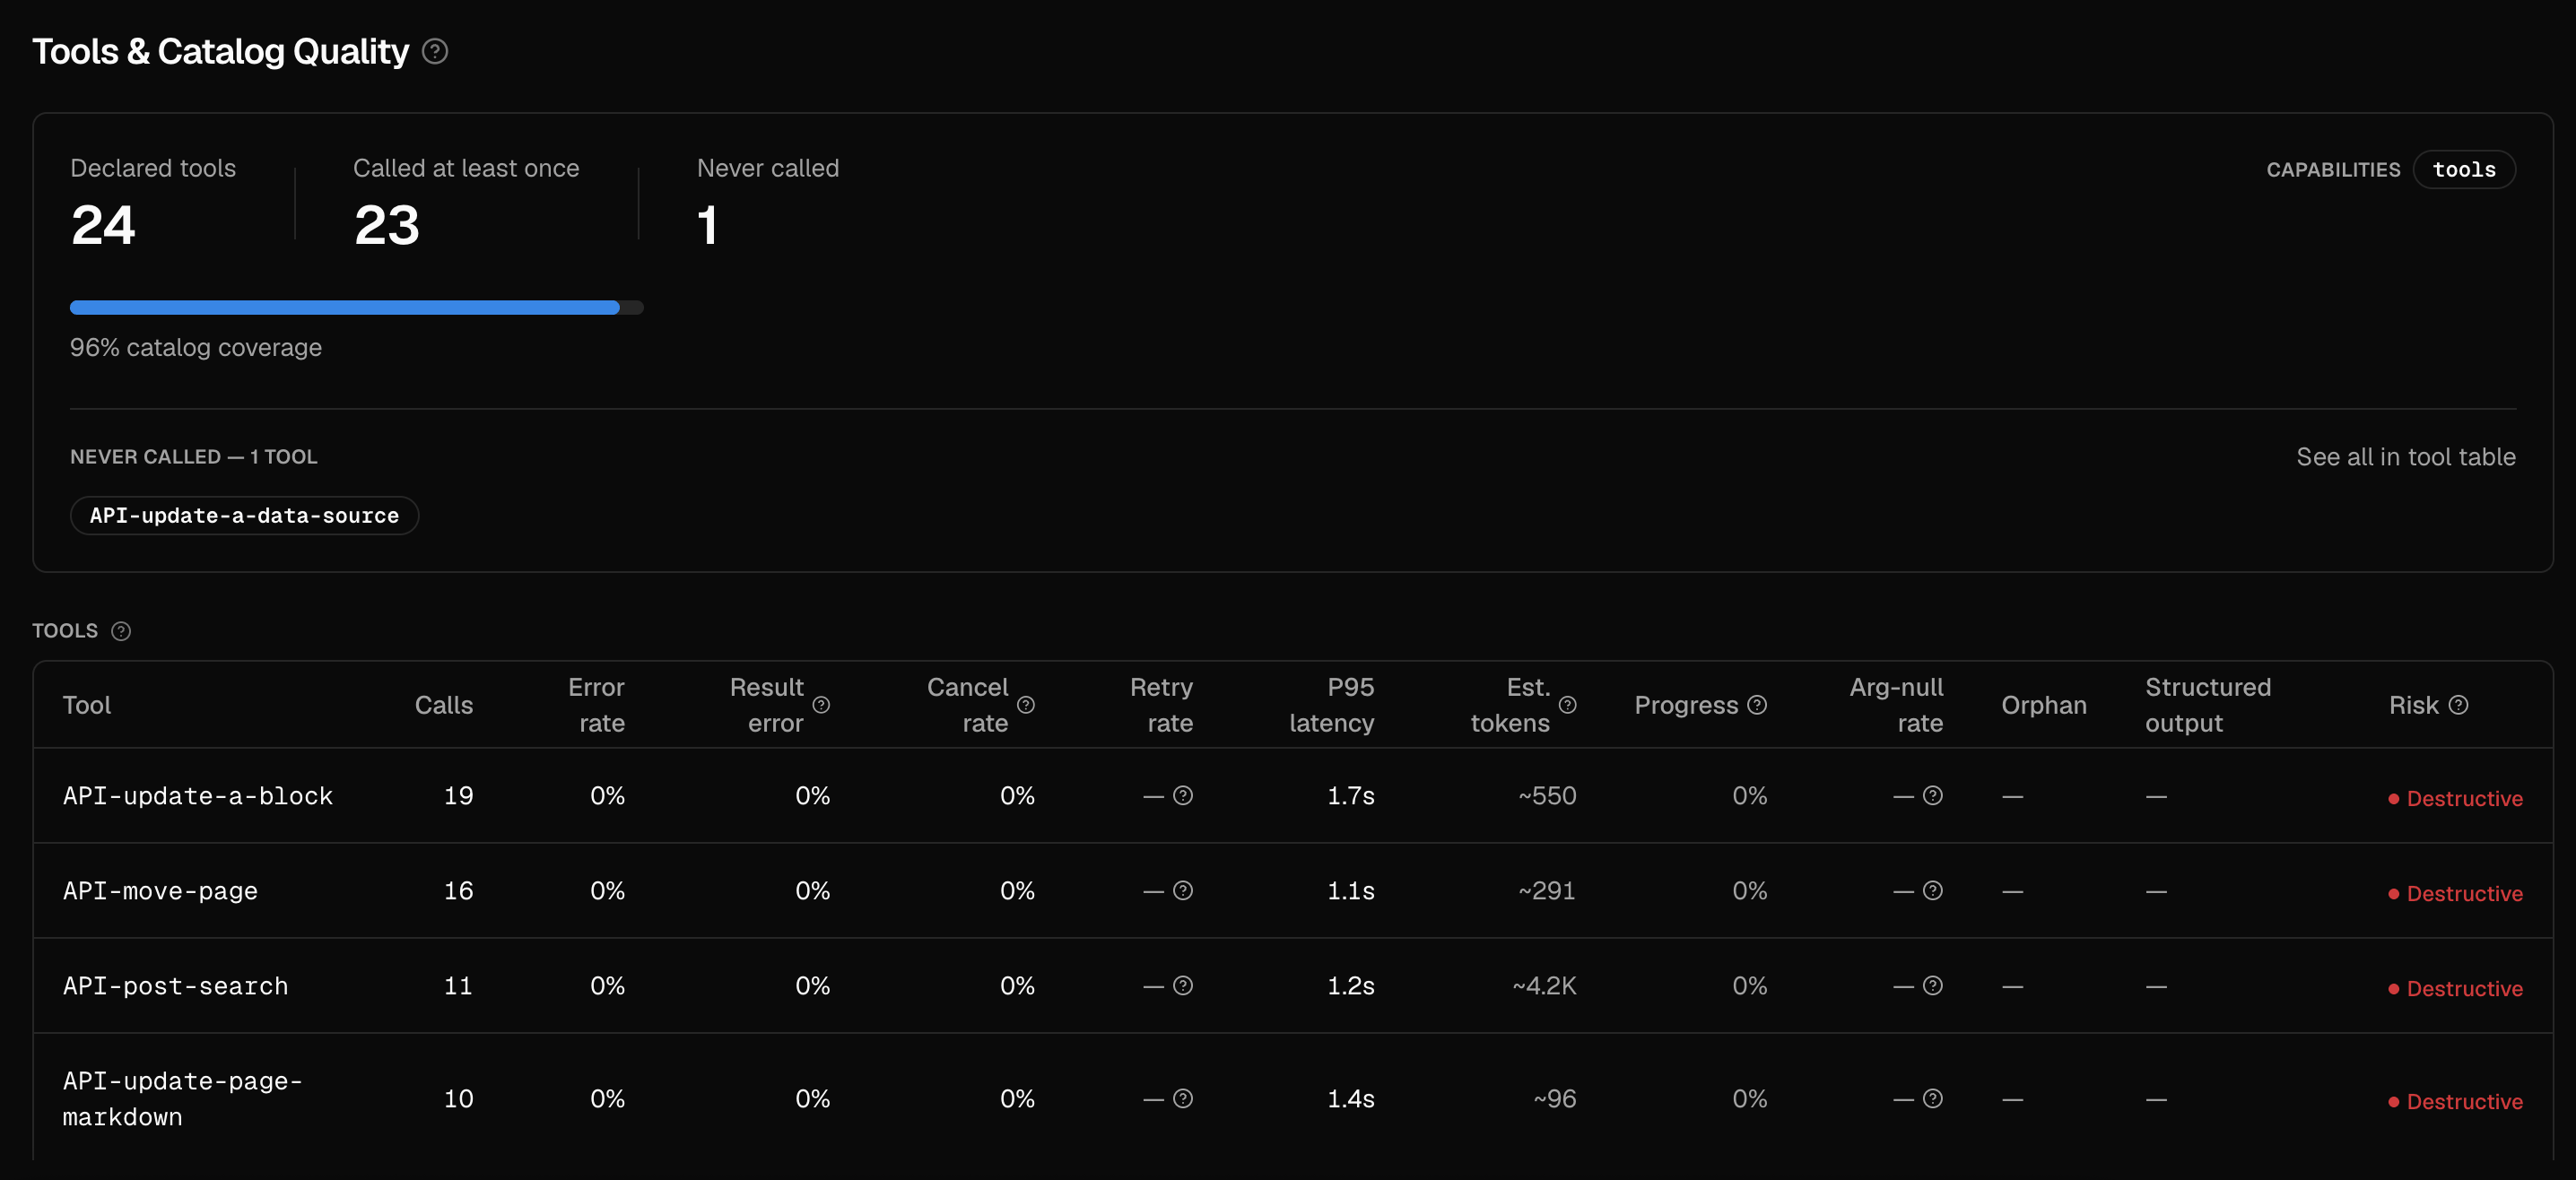
Server Signals
What the server pushes to clients unprompted, without being asked.Usage Patterns
Call volume by day and hour (UTC), for the selected range.Requests
A raw, per-request view of network traffic for the linked server.Events
A raw terminal/event log stream for the linked server.Managing a setup
From the setup’s detail page:- Copy or reveal the API key at any time
- Archive a setup you’re pausing (and unarchive it later)
- Revoke a setup permanently - type
confirmto confirm. Any server still using that key stops sending telemetry immediately, and this can’t be undone.
What’s next
TypeScript
Install and configure
mcpfy-pulse for Node.js MCP servers.Python
Install and configure
mcpfy-pulse for FastMCP or the official mcp SDK.