> ## Documentation Index
> Fetch the complete documentation index at: https://docs.mcpfy.ai/docs/llms.txt
> Use this file to discover all available pages before exploring further.
# Overview
> Drop-in telemetry for any MCP server - tool-level usage, health score, and quality signals in your MCPfy dashboard
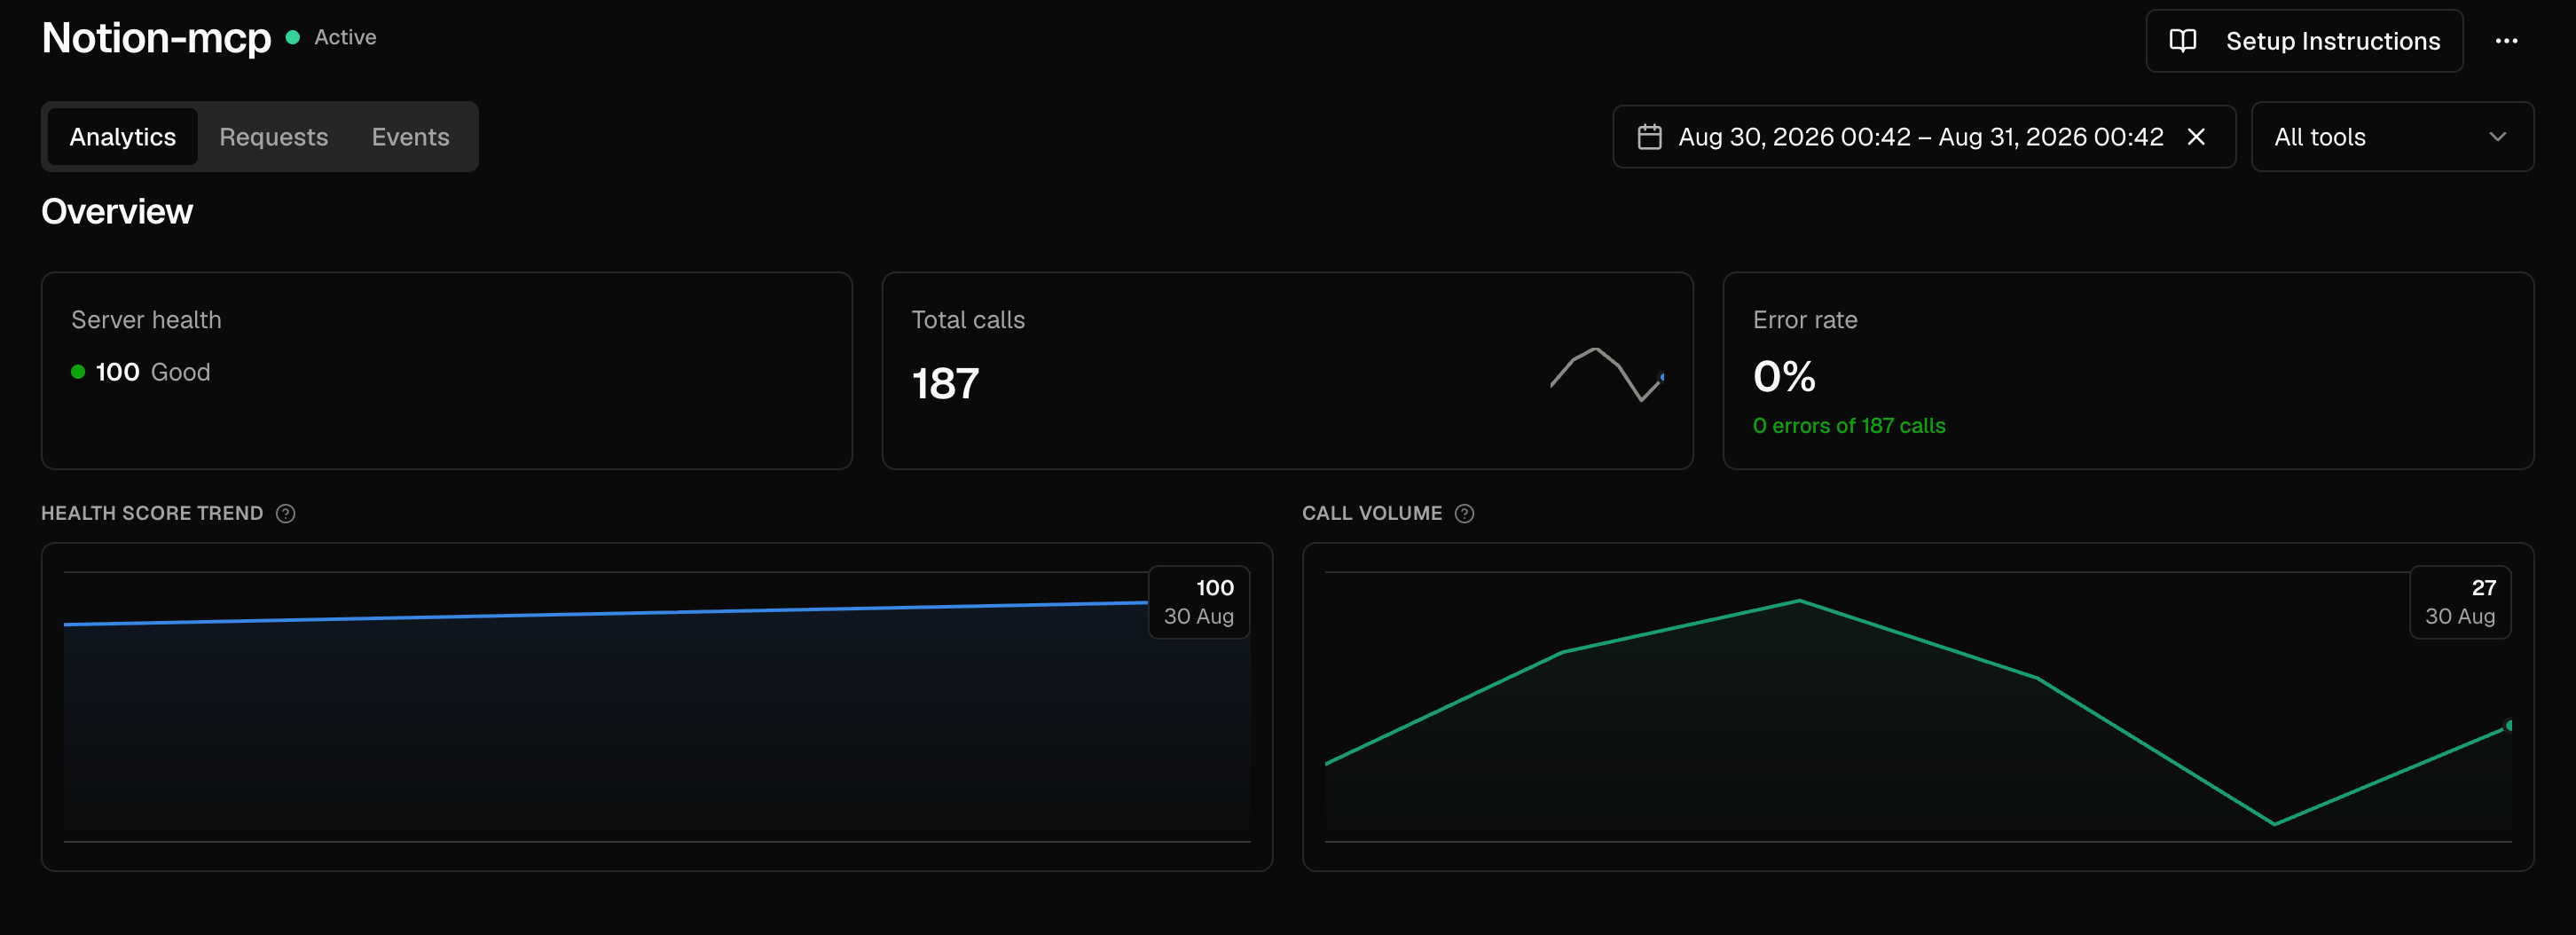
Pulse is a drop-in telemetry SDK that captures tool-level usage and performance for your MCP server, then turns it into a real-time health signal in your MCPfy dashboard.
* 📊 Tool-level telemetry
* 🩺 Server health score
* 🧠 Tool intelligence
* 🎯 Result quality scoring
* 🔌 Works with any MCP server - `mcpfy-sdk`, the official MCP SDK (`@modelcontextprotocol/sdk` for TypeScript, `mcp` for Python), FastMCP, or a server you didn't write at all
 ## How it works
Every MCP transport - stdio, SSE, StreamableHTTP - funnels all JSON-RPC traffic through one seam: a `send`/`onmessage` pair in TypeScript, a read/write stream pair in Python. Pulse wraps that seam, so it sees every request and response regardless of which SDK built the server.
For servers you don't have the source for, `mcpfy-proxy` does the same thing from the outside: it becomes the process your MCP client spawns, runs the real command as its own child, and forwards every byte between them unchanged while classifying JSON-RPC messages on the side.
None of the three install modes below edit your files for you. Pick the one that matches your situation.
## What can be tracked
Pulse classifies every JSON-RPC message crossing the wrapped seam and turns it into structured events - never raw content. This is what directly powers the [dashboard's](/docs/pulse-sdk/dashboard) Connections & Clients, Tools & Catalog Quality, and Server Signals sections.
| Category | What's captured |
| -------------------------- | ----------------------------------------------------------------------------------------------------------------------------------------------------------------------------------------------------------------------------------------------------- |
| **Tool calls** | Tool name, request/response size, duration, outcome (`ok` / `error` / `cancelled`), the JSON-RPC error code on failure, whether the result reported its own in-band failure (`isError`), and whether the tool sent progress updates while it ran |
| **Prompts & resources** | Prompt name or resource URI, size, duration, and outcome - same shape as tool calls |
| **Connection & handshake** | Client name and version, the negotiated protocol version, and which optional capabilities each side declared (subscriptions, sampling, elicitation, and the rest) |
| **Catalog quality** | For every tool in `tools/list`: whether it has a description and how long it is, how many of its parameters are individually documented, whether it declares structured output, and its `readOnly` / `destructive` / `idempotent` / `openWorld` hints |
| **Server signals** | Log-level notifications (level only), and how often the tool/resource/prompt catalog changes underneath a running session |
Pulse never sends argument values, result content, resource contents, description text, or log message text - only their presence, size, and shape. The one exception noted above is `tools/list`, where description/param **length** is captured (never the text itself) to power description-quality scoring.
## Get your API key
Every install mode needs an API key. Create one from your MCPfy dashboard (**Dashboard → Telemetry**), then set it as the `MCPFY_API_KEY` environment variable.
Create an API key and see [what the dashboard shows](/docs/pulse-sdk/dashboard) once events start flowing.
## Which install mode do I need?
Pulse ships bundled with `mcpfy-sdk`. Set `MCPFY_API_KEY` and restart your server - no code to write.
Install `mcpfy-pulse` and add two lines to your code, right before you connect your transport or run your server. See the [TypeScript](/docs/pulse-sdk/typescript) or [Python](/docs/pulse-sdk/python) guide.
A server from GitHub or npm, running under Claude Desktop or Cursor. Route its command through `mcpfy-proxy` in your MCP client's config - no code needed. Covered in both the [TypeScript](/docs/pulse-sdk/typescript) and [Python](/docs/pulse-sdk/python) guides.
If `apiKey` (or `MCPFY_API_KEY`) is unset, every install mode is a complete no-op - the original transport or streams are returned untouched. It's safe to leave the instrumentation in place across all your environments, including local dev.
## Next steps
Install and configure `mcpfy-pulse` for Node.js MCP servers.
Install and configure `mcpfy-pulse` for FastMCP or the official `mcp` SDK.
See tool-level usage, health scores, and quality signals once data starts flowing.
## How it works
Every MCP transport - stdio, SSE, StreamableHTTP - funnels all JSON-RPC traffic through one seam: a `send`/`onmessage` pair in TypeScript, a read/write stream pair in Python. Pulse wraps that seam, so it sees every request and response regardless of which SDK built the server.
For servers you don't have the source for, `mcpfy-proxy` does the same thing from the outside: it becomes the process your MCP client spawns, runs the real command as its own child, and forwards every byte between them unchanged while classifying JSON-RPC messages on the side.
None of the three install modes below edit your files for you. Pick the one that matches your situation.
## What can be tracked
Pulse classifies every JSON-RPC message crossing the wrapped seam and turns it into structured events - never raw content. This is what directly powers the [dashboard's](/docs/pulse-sdk/dashboard) Connections & Clients, Tools & Catalog Quality, and Server Signals sections.
| Category | What's captured |
| -------------------------- | ----------------------------------------------------------------------------------------------------------------------------------------------------------------------------------------------------------------------------------------------------- |
| **Tool calls** | Tool name, request/response size, duration, outcome (`ok` / `error` / `cancelled`), the JSON-RPC error code on failure, whether the result reported its own in-band failure (`isError`), and whether the tool sent progress updates while it ran |
| **Prompts & resources** | Prompt name or resource URI, size, duration, and outcome - same shape as tool calls |
| **Connection & handshake** | Client name and version, the negotiated protocol version, and which optional capabilities each side declared (subscriptions, sampling, elicitation, and the rest) |
| **Catalog quality** | For every tool in `tools/list`: whether it has a description and how long it is, how many of its parameters are individually documented, whether it declares structured output, and its `readOnly` / `destructive` / `idempotent` / `openWorld` hints |
| **Server signals** | Log-level notifications (level only), and how often the tool/resource/prompt catalog changes underneath a running session |
Pulse never sends argument values, result content, resource contents, description text, or log message text - only their presence, size, and shape. The one exception noted above is `tools/list`, where description/param **length** is captured (never the text itself) to power description-quality scoring.
## Get your API key
Every install mode needs an API key. Create one from your MCPfy dashboard (**Dashboard → Telemetry**), then set it as the `MCPFY_API_KEY` environment variable.
Create an API key and see [what the dashboard shows](/docs/pulse-sdk/dashboard) once events start flowing.
## Which install mode do I need?
Pulse ships bundled with `mcpfy-sdk`. Set `MCPFY_API_KEY` and restart your server - no code to write.
Install `mcpfy-pulse` and add two lines to your code, right before you connect your transport or run your server. See the [TypeScript](/docs/pulse-sdk/typescript) or [Python](/docs/pulse-sdk/python) guide.
A server from GitHub or npm, running under Claude Desktop or Cursor. Route its command through `mcpfy-proxy` in your MCP client's config - no code needed. Covered in both the [TypeScript](/docs/pulse-sdk/typescript) and [Python](/docs/pulse-sdk/python) guides.
If `apiKey` (or `MCPFY_API_KEY`) is unset, every install mode is a complete no-op - the original transport or streams are returned untouched. It's safe to leave the instrumentation in place across all your environments, including local dev.
## Next steps
Install and configure `mcpfy-pulse` for Node.js MCP servers.
Install and configure `mcpfy-pulse` for FastMCP or the official `mcp` SDK.
See tool-level usage, health scores, and quality signals once data starts flowing.